What a £3,000 Pay Rise Is Actually Worth
A £3,000 raise sounds like £250 a month. A basic rate taxpayer keeps £180, a higher rate taxpayer £145, and someone in the 60% trap keeps just £95.
This article represents a personal view and is not financial advice. Tax bands, National Insurance rates, and thresholds change, so check current government guidance for the figures that apply to you.
A £3,000 pay rise sounds like a simple number: £250 a month. It never arrives as that, and the gap between the headline figure and what actually lands in your account is the first thing worth being precise about. The second thing, and the more important one, is that the monthly figure isn't really the point at all.
What actually lands in your account
What a raise is worth depends entirely on which band the extra money falls into (the figures here use the rest-of-UK bands; Scottish income tax rates and thresholds differ). A basic rate taxpayer (£35,000 to £38,000) loses 20% to Income Tax and 8% to National Insurance on the extra, keeping £2,160 a year. A higher rate taxpayer (£55,000 to £58,000) loses 40% and 2%, keeping £1,740. Same headline, meaningfully different outcome.
| Band | Taken | Kept a month |
|---|---|---|
| Basic rate | 28% | £180 |
| Higher rate | 42% | £145 |
| 60% band | 62% | £95 |
The 60% trap between £100,000 and £125,140
There's a stretch of income where the arithmetic gets genuinely punishing, and it catches people precisely because it doesn't appear in any published tax band. Above £100,000, your personal allowance is withdrawn at £1 for every £2 you earn, which means each extra pound is taxed at 40% and simultaneously drags a previously tax-free 50p into tax at 40%. The effective marginal rate works out at 60% Income Tax, plus 2% NI. A £3,000 raise landing entirely in that window keeps you £1,140 a year, or £95 a month, from a raise that sounded like £250. It's also the zone where salary-sacrificing the raise straight into a pension is at its most efficient, for exactly the same reason.
That window has enough moving parts, including a childcare cliff sitting on top of it, to deserve its own piece: the 60% tax trap between £100,000 and £125,140 covers where it starts, what it does to a rise, and the pension route out.
The monthly number versus the decade number
The reframe that matters is this. £180 a month is a nice-to-have: a slightly better food shop, an extra weekend away. Absorbed into general spending, its ten-year effect on your net worth is precisely zero. The raise happened; your trajectory didn't move. That's the default outcome for most pay rises, because spending expands quietly to meet income.
Now run the same £180 a month down two other paths for ten years. Invested in a stocks and shares ISA growing at 5% a year, say, the contributions total £21,600 and the pot reaches roughly £27,900. Or sent at the mortgage instead: overpaying £180 a month on a £200,000 balance at 4.5% builds about £27,200 of extra equity over the same ten years, and if you keep it up for the life of a 25-year loan, it clears the mortgage roughly five and a half years early and saves around £34,000 in interest. Either way, the same raise that was worth nothing as spending is worth £27,000 to £28,000 of net worth a decade on, and still compounding.
Both halves of that comparison are worth checking against your own numbers rather than this example's. On the debt side, the mortgage overpayment calculator takes your balance, rate and term and shows what an extra £180 a month actually clears and saves.
On the investing side, the answer moves a long way with the growth rate you assume. The compound interest calculator shows what a monthly contribution grows into, with the growth shown apart from what you actually paid in.
The pension route is stronger again, particularly for higher earners. A higher rate taxpayer who salary-sacrifices the whole £3,000 raise gives up £145 a month of take-home, but £250 a month goes into the pension gross. At 5% growth that's a pot of roughly £38,800 after ten years, built from spending power you'd barely have registered losing.
You don't have to pick one
None of this is an argument for saving every penny of every raise. A reasonable pattern is a split: let some of it improve life now, and commit the rest to the balance sheet before it disappears into the general current of spending. Even half of the £180 example, £90 a month invested, is around £14,000 in ten years. The households that convert raises into wealth aren't doing anything sophisticated; they're just deciding where the money goes before it decides for itself.
The mortgage version of this decision has its own trade-offs, and we've written separately about whether overpaying is right for you. But the underlying principle is the same: the raise itself changes very little. What you do with the difference changes the decade.
This is exactly the kind of question a forecast answers better than a payslip. In CrestCast you can apply the new salary, with UK tax and NI calculated properly and the taper included, then compare versions: one where the extra take-home is spent, one where it's invested or overpaid, and watch the gap between the two net worth figures widen year by year before you've committed to either.
›How to check this
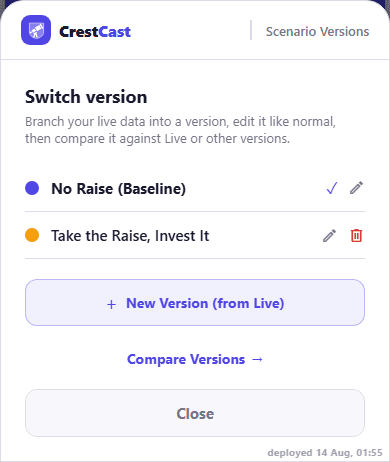
This example uses CrestCast's demo profile, with the Live data renamed "No Raise (Baseline)" and a branched "Take the Raise, Invest It" version created from it.
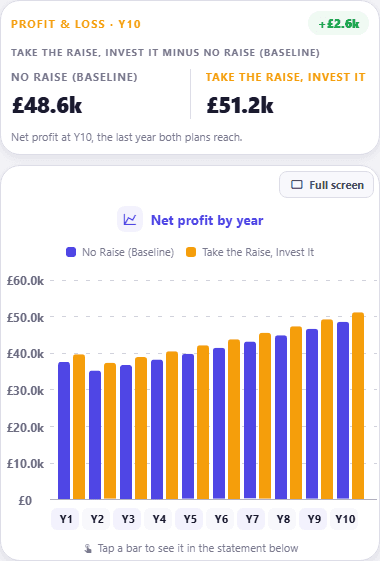
Two things changed on the branch: the salary and the Stocks ISA contribution. The £3,000 raise from this post's own basic-rate example takes gross salary from £44,000 to £47,000, and the two pay rises already scheduled in the demo household (to £45,760 from 11/2027 and to £51,250 from 09/2031) each carry the same £3,000, so the raise lasts the whole forecast instead of being overwritten by the next scheduled rise. The existing Stocks ISA's annual contribution goes up by £2,160, this post's own figure for a basic-rate taxpayer's after-tax uplift from that raise. Everything else, including all bills and other assets, was left untouched.
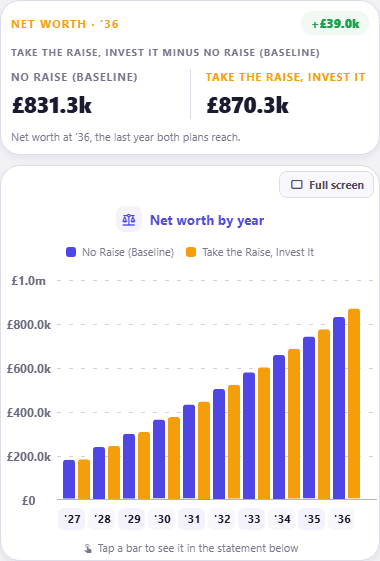
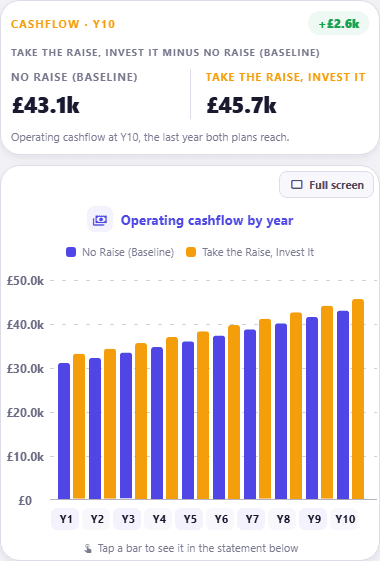
The charts show the Combined household view over a 10-year forecast, comparing the two branches via CrestCast's Compare Versions screen. This illustrates the "invest it" path specifically, not the "spend it" or "overpay the mortgage" paths also discussed in the text above. The household view is used rather than the personal one because the personal view holds no mortgage, and with no capital repayment in it the net profit and the operating cashflow are the same number, which would have made two of the three charts identical.
Growth rates in CrestCast are real rates, meaning growth above inflation. The demo household's property grows at 3% above inflation and its Stocks ISA at 7% above inflation, with inflation set at 2.5%. The 7% is an assumption chosen for the demo, not a forecast. Both branches carry the same assumptions, so changing either in Settings moves both bars rather than the gap between them.
Ten years of a flat £2,160 is £21,600, and the gap at 2036 is £36.6k. Two things account for the difference, and neither is a salary growth assumption: the demo household's is set to zero, and in any case it applies equally to both branches, so it could not open a gap. First, the figures are nominal, and pay keeps pace with the 2.5% inflation assumption, so the £3,000 of extra gross is worth more in cash terms every year. Second, the uplift is invested at 7% above inflation rather than sitting still. The demo household also has a spare-cash waterfall switched on, which sweeps whatever is left above its buffer into the same Stocks ISA, so the raise on its own, with no explicit contribution added at all, is already worth £36.4k by 2036.
See what your pay rise is really worth
Schedule the rise on the date it starts and CrestCast works the tax, National Insurance, pension and student loan out of it, then shows what actually lands, across every year it touches.
30 days free, no card. Then £7.99 a month or £79.99 a year for the whole household.
Put your own numbers in and see the next ten years.
30 days free, no card. Then £7.99 a month or £79.99 a year for the whole household.
See a decision like this in a sample household's ten-year forecast. Open the sample forecast →