Redundancy-Proofing Your Finances
The standard advice is three to six months of expenses in an emergency fund. For a household with a mortgage and one income doing most of the heavy lifting, that number often falls short. This is how to calculate your own.
This article represents a personal view and is not financial advice. Statutory redundancy rules and rates change, so check current government guidance for figures that apply to your situation.
"Three to six months of expenses" is the standard emergency fund advice, repeated so often it's rarely questioned. For a single person renting with no dependents, it's a reasonable rule of thumb. For a household with a mortgage, perhaps childcare costs on top, and one income carrying more of the load than the other, it's frequently not enough, and the only way to know your real number is to actually model it.
The Salary Isn't the Only Thing You Lose
The obvious loss in redundancy is the monthly salary. The less obvious losses are the employer pension contributions that stop alongside it, any life insurance or income protection provided through work rather than held personally, and sometimes health cover for the whole family. Add these up and the true monthly gap is usually larger than the payslip number alone suggests.
What Statutory Redundancy Pay Actually Gives You
If you're eligible, statutory redundancy pay is calculated from age, length of service, and weekly pay up to a government-set cap, and it can provide a genuinely useful cushion. It's rarely a full replacement, though, for lost income over an extended job search, especially for shorter-tenure employees or higher earners whose pay well exceeds the statutory cap. Many employers offer more than the statutory minimum, so it's worth understanding your specific contract rather than assuming the statutory floor is what you'd receive.
The Number That Actually Matters: Your Monthly Burn Rate
The number that actually matters is your household's true monthly gap if one income stopped tomorrow, and it takes four steps to get to it.
- Calculate true fixed monthly outgoings, not a rough guess but the actual mortgage, bills, and childcare total.
- Add any statutory or contractual redundancy pay you'd actually be entitled to, not an assumed figure.
- Subtract what the remaining income (if any) already covers, so you're left with the true monthly gap.
- Divide your accessible savings by that gap to get real months of runway, which is very often a different number to "three to six months of expenses."
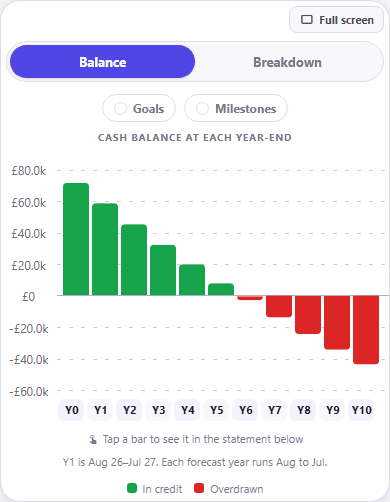
To make that concrete, here's the demo household with all employment income stopped and nothing else touched. It lives off the roughly £80,000 it already holds across its current account and savings. This is the running cash balance the forecast produces:
How Concentrated Is the Income You'd Be Losing?
Notice what does the most work in that chart: a surviving income. Everything above treats losing an income as an event of fixed size and asks how long you could absorb it, but the size of the event depends on how concentrated your income was to begin with. A household where one salary covers the mortgage on its own is far more fragile than a household with the same total income split across two earners, because one redundancy removes most of the cover rather than part of it. And two salaries can be less diversified than they look: if both of you work for the same employer, or in the same sector facing the same downturn, one bad year can take both incomes at once.
Concentration can be reduced gradually while you're still employed. Freelance or contract work in the skills you already sell to your employer is the most common route, and part-time or seasonal work is another. A spare room can produce lodger income, and the government's Rent a Room scheme lets you receive a set amount of that tax-free each year (check current guidance for the threshold). Interest and investment income count too, though they only become a meaningful monthly amount once the underlying savings are substantial. The caveat is that almost every secondary income starts small and takes time to grow, so it complements the cash buffer rather than replacing it. What it does immediately is shrink the monthly gap from the burn-rate exercise above, and a smaller gap stretches the same savings over more months.
Employability is a form of diversification as well, even if it never appears on a payslip. Current skills, warm professional contacts, and a CV that doesn't need three weekends of archaeology before you can send it all shorten the time between jobs. The arithmetic is the same as building a bigger buffer: a gap of three months costs half what a gap of six months does, so anything that shortens the search protects your runway just as surely as anything that funds it.
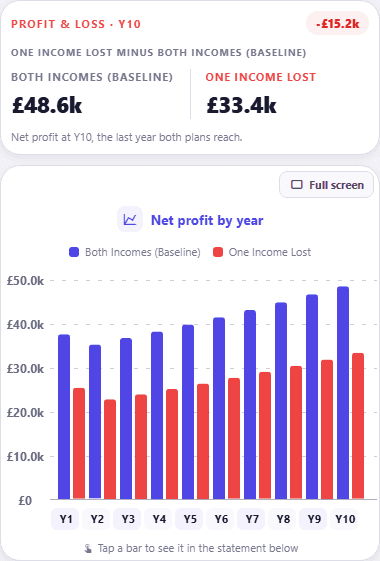
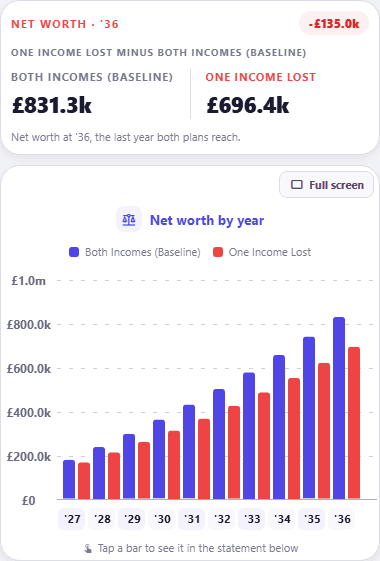
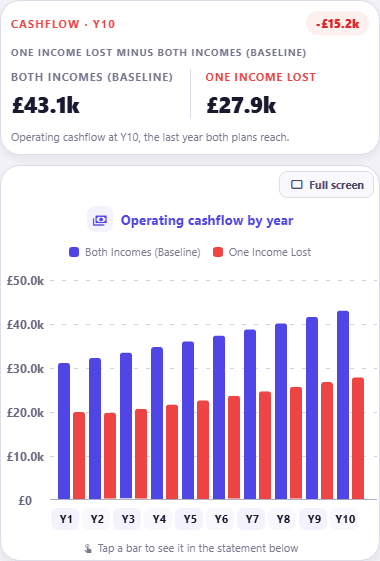
The chart above is the severe case, every income gone. The more common one is losing a single salary out of two, and that is a different shape of damage worth seeing on its own:
Stress-Testing, Not Just Saving
Building an emergency fund is only half the exercise. The other half is knowing, in advance, which bills bite first if the income stops, and what decisions you'd need to make and when.
Once the runway you want is a number rather than a rule of thumb, getting there becomes a straightforward saving question. The savings goal calculator turns a target buffer and a date into the monthly amount it takes to build it.
In CrestCast you can duplicate your household as a scenario, zero out one income, and watch your cashflow and net worth play out month by month exactly as they would in reality, turning a vague worry into a concrete, actionable number.
This page assumes one income keeps running. Would you bet your house on your pay arriving? works through what happens when it stops, including why two incomes in one household are often really one.
›How to check this
Both use CrestCast's demo household. They are two different severities of the same event, which is why they are shown separately rather than as one chart.
The runway chart is the severe case: all employment income stopped, nobody paying into the joint account, discretionary saving paused, and the mortgage, bills and existing debts left running. It is the Cashflow view on its Balance setting, so the bars are the cash actually sitting in the accounts at each year end rather than the movement through them, which is what makes the crossing point below zero readable.
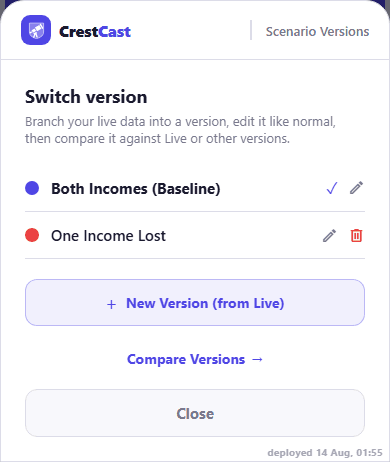
The three-statement comparison is the milder case: the second earner's income set to zero, and with it the £1,050 a month she paid into the joint account, with the Live data renamed "Both Incomes (Baseline)" and a branched "One Income Lost" version created from it. Nothing else was changed, so every difference between the branches comes from that one income. The charts are the Combined household view over a 10-year forecast, since a lost second income does not appear in a personal view at all.
The comparison charts are in nominal money, not adjusted for inflation, and the demo household's numbers are illustrative. Your own crossing point and your own gap will differ.
Find out how many months you have, before you need to
Save a version with one income stopped and read the month the balance crosses zero. It is a hard number, and it is far better to meet it now than during a consultation period.
30 days free, no card. Then £7.99 a month or £79.99 a year for the whole household.
Put your own numbers in and see the next ten years.
30 days free, no card. Then £7.99 a month or £79.99 a year for the whole household.
See six months without pay in a sample household's forecast. Open the sample forecast →