Comparing Financial Scenarios: How to See a Decision's Impact Before You Make It
Big financial decisions are usually made on gut instinct, because modelling the 'what if' by hand is tedious enough that nobody bothers. Here's how saving and comparing forecast versions changes that.
Most big financial decisions (take the new job, overpay the mortgage, move house, have another child) get made on gut instinct. It isn't that people don't want to model them properly; it's that doing it by hand in a spreadsheet is tedious enough that almost nobody actually finishes the exercise.
The problem with a single forecast
A forecast built from your current numbers tells you where you're heading if nothing changes. It's much less good at answering "what if": what if you overpaid the mortgage by £200 a month, what if you took the job with the lower base but better pension, what if you moved somewhere with a bigger mortgage but shorter commute. Editing the numbers to test that answer would overwrite the baseline you actually wanted to keep.
Saving a named version
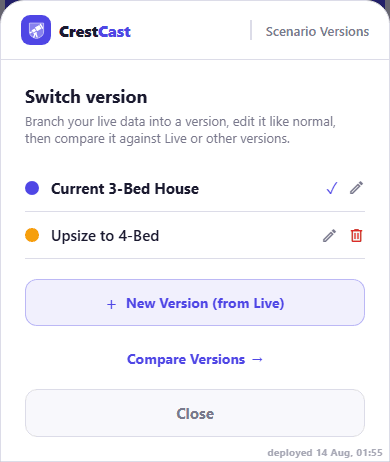
CrestCast lets you save your current forecast as a named version, before you touch anything. That gives you a fixed baseline, your household exactly as it stands today, that stays put no matter what you do next. You can rename it to something more memorable than "Live" too, so it's obvious at a glance which branch is which once you're comparing more than one.
Comparing before and after
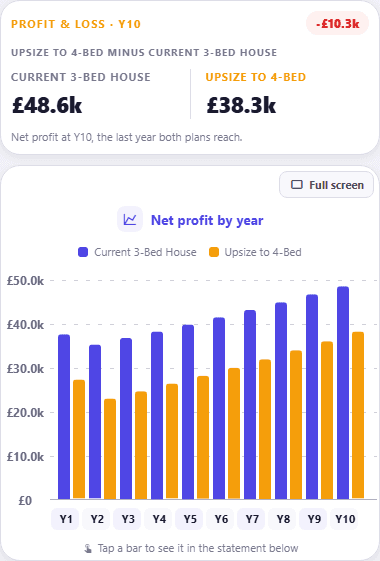
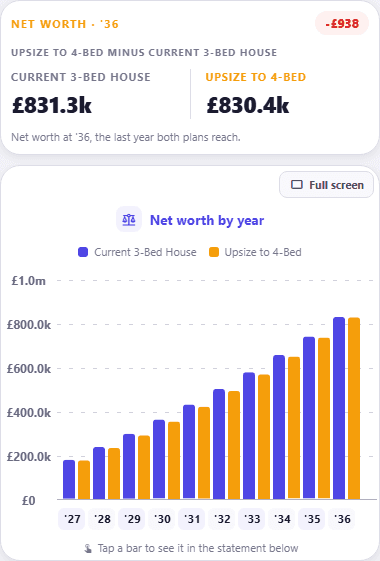
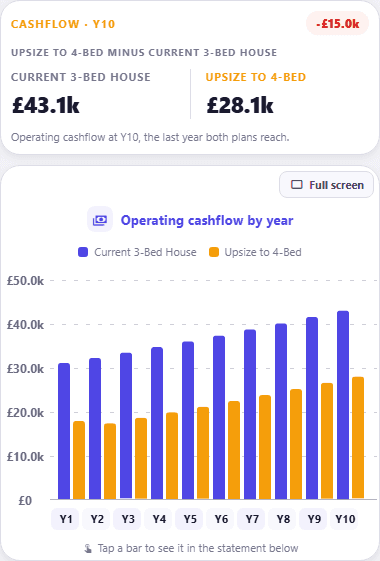
From there, you can adjust the numbers for the decision you're actually weighing up, and compare the result against the saved version side by side. You see the effect on net worth in five years, when the mortgage clears, and what monthly cashflow looks like either way. The decision stops being a guess and becomes a comparison of two concrete pictures.
Compare Versions puts the two branches side by side on the same charts automatically, a pair of bars for every year, with a headline card above each chart giving both branches' figure at the last year they both reach and the difference between them.
Useful after the decision too
The same feature is just as useful once you've made a decision, not only before: save a version at the start of the year and compare it against where you actually are a few months later, to see whether reality tracked the plan or drifted from it, then adjust from there.
›How to check this
The version switcher and comparison charts shown here are reused from the worked example in "Should I Upsize My Home?". That's a real branch changing a property value, mortgage, and two bills, compared against the unchanged baseline over a 10-year household forecast.
See the Upsize post for the specific numbers and the reasoning behind that example.
Comparing two versions only helps if you know which assumptions are doing the work. How Accurate Is a Financial Forecast, Really? shows what an assumed return and a stale input are each worth over a decade.
Try the decision before you make it
Branch your plan into a named version, change whatever you like inside it, and read the two futures against each other across cashflow, profit and loss and net worth.
30 days free, no card. Then £7.99 a month or £79.99 a year for the whole household.
Put your own numbers in and see the next ten years.
30 days free, no card. Then £7.99 a month or £79.99 a year for the whole household.