Your Forecast Shouldn't Go Overdrawn
A forecast that lets your current account sink £28,000 into the red is not modelling your life. It is modelling someone who watches it happen and does nothing. Here is the rule that fixes it, what it actually costs, and the month it stops working.
Here is a household that is not in trouble. Two incomes paying £5,200 a month into a joint account, £4,255 of bills, a £215,000 mortgage costing £1,195 a month, £32,000 sitting in savings. They are about £250 a month short, which is the kind of gap that hides easily inside an ordinary year.
Run that forward ten years in a spreadsheet and the current account ends at minus £27,752. Not once, not as a wobble. It crosses zero inside the first year and then falls in a straight line for a decade, past minus £10,000, past minus £20,000, while £32,000 sits untouched in a savings account three taps away on the same banking app.
Nobody lives like that. The moment that account went £400 overdrawn, a real person would move money across from savings, and they would keep doing it. So the forecast is not wrong about the arithmetic. It is wrong about the person. It has modelled someone who watches their account drain for four years and never once opens the savings tab.
A Projection Is Not a Plan
What the spreadsheet is missing is not a formula. It is a policy, and a policy has to be applied at every step, with the result of each step feeding the next.
CrestCast calls that policy the spare cash waterfall. You write it once: a minimum balance to hold in the current account, an order to raid your savings pots in when a month comes up short, and where a surplus goes when there is one. The forecast then obeys that rule every month for ten years, and every statement in the app is computed with the rule already applied rather than adjusted for it afterwards.
One Monday in November
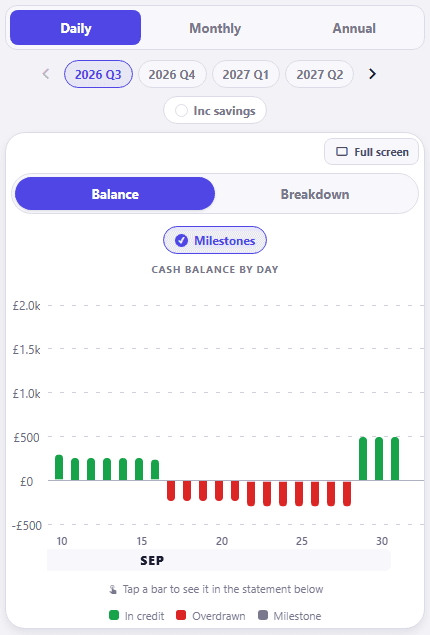
Before any ten-year arithmetic, here is the day the rule earns its keep, on the daily cash balance view in the app. The household is the app's sample family: a joint account, £800 a month paid into it on the 28th (the 27th in November, as the 28th is a Saturday), the mortgage and the usual bills leaving through the month, £12,000 of Family Savings sitting beside it, and one lumpy annual bill. £480 of car insurance, due on 16 November.
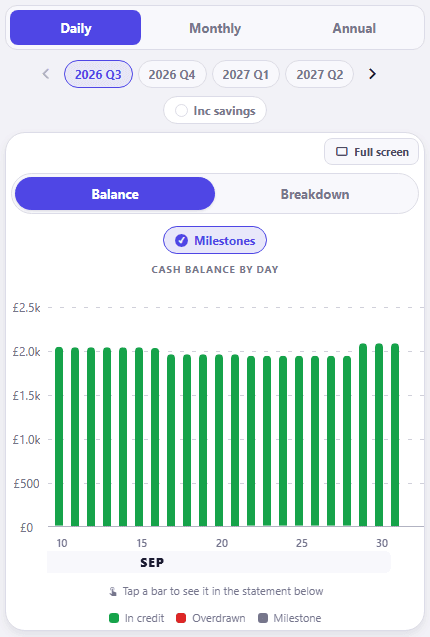
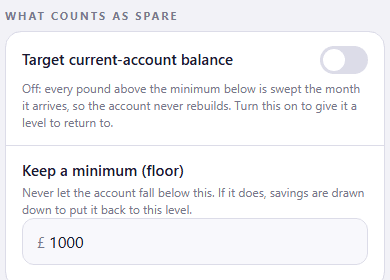
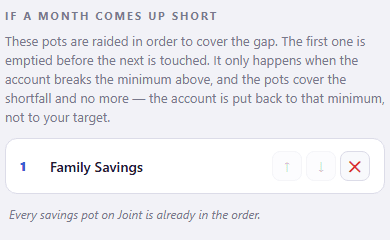
Now the same household, the same November, with exactly one thing changed: a floor rule on the joint account. Hold £1,000 as a minimum, and if the account breaks it, cover the shortfall from Family Savings.
The Setting That Made the Difference
That contrast is one setting, and it is one you write rather than something the app decides for you. Two fields on the joint account's waterfall screen:
The Same Household, Twice
The screenshots above show one month. The charts below show what the same rule does over the whole decade, run through CrestCast's own forecast engine twice, on a household simplified enough that the arithmetic is checkable by hand: the same profile, the same incomes, the same bills, the same mortgage, the same savings, stated in full in the methodology at the foot of this page. The only difference between the two runs is whether the waterfall is switched on, with a £1,000 minimum and the savings pot named as the place to draw from.
The flat line is the interesting one. It is flat because that is what a minimum balance means. Money is pulled across from savings in whatever amount is needed to put the account back on £1,000, no more, and then the next month happens. It is the boring, obvious thing a real household does, done every month without anyone having to remember.
It Does Not Create Money
A rule that turns a £27,752 overdraft into a steady £1,000 balance raises the obvious question: where did the money come from. Here is the other half of the same two runs.
Put the two together and the household's net worth at year ten is £188,032.49 in both runs. Identical, to the penny, and identical at every year in between. Cash plus savings is the same number either way, because the waterfall moves money and does not manufacture it.
The Month It Stops Working
Look again at where the pot ends: £3,248, with a £250 a month gap still running. That is about thirteen months of headroom left. The waterfall has not fixed this household's problem. It has bought them roughly eleven years, shown them the deadline, and made the cost legible while doing it.
Give the same household £12,000 of savings instead of £32,000 and the engine is blunt about it. The pot reaches zero in month 54. The current account holds £1,000 right up to month 53, breaks the minimum in month 54, and from there falls at the same £250 a month as the unrouted run, ending at minus £15,752. The floor holds exactly as long as there is something under it.
A rule that holds a balance flat could easily be hiding the problem. This one does the opposite. The unrouted forecast tells you that you are short, in units of overdraft, which is a currency nobody plans in. The routed one tells you the month your savings run out, which is a date you can do something about.
The Rule Has to Show Its Working
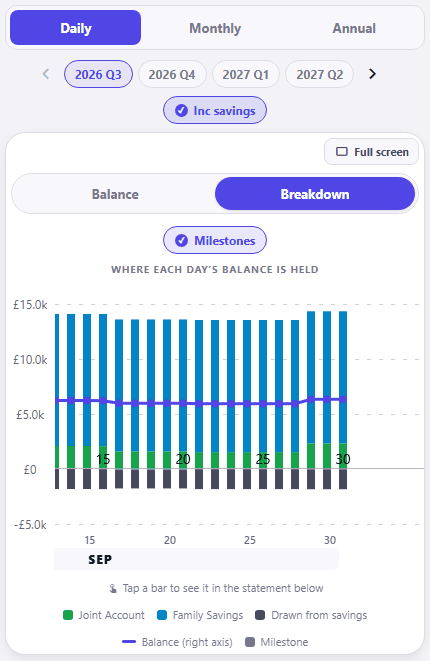
A forecast that quietly moves money around is worse than one that does not move it at all, because you can no longer tell which of its numbers you typed and which it invented. So when the waterfall fires, it says so. On the cash balance breakdown, with savings included, every pot is its own named segment beside the current account, so you can watch the one that paid getting smaller.
The Same Rule Runs Upwards
The household above only ever draws down, because it is short every month. Most of the value is in the other direction. You can set a target balance for the current account, and anything above it cascades down an ordered list you write: an ISA up to its allowance, a credit card as a real overpayment, an easy access pot up to a target, in whatever order you decide. The allowances are the right ones per pot type and per tax year, and an overpayment genuinely re-amortises the debt rather than moving a number between two boxes, so the balance, the interest and the payoff date all move.
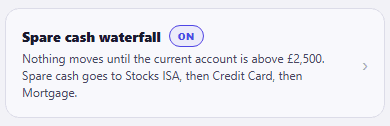
The mechanics of all of it, the five presets, the limits each step can carry, the awkward months and what the rule does not do, are set out on the surplus cash routing page. That is the page to read if you have decided the idea is sound and want to know exactly how it behaves.
What This Is Not
- It does not move your money. CrestCast has no bank connection and transfers nothing. The waterfall is a modelling rule that runs inside the forecast, so you can see what a policy would do before you go and set the standing orders up yourself.
- It is not a forecast beyond ten years. Every CrestCast forecast projects ten years ahead, a deliberate cap, so every figure on this page is a decade and no more.
- It is off unless you turn it on. With the waterfall off, the forecast behaves exactly as it did before the feature existed. Nothing is quietly rearranged on your behalf.
- It is not advice about what your order should be. The app applies the order you write. Deciding what belongs at the top of it is a separate question, and one worth taking properly.
If you want the order itself rather than the machinery, the UK personal finance flowchart sets out the usual priority order, from emergency fund to pension match to expensive debt. Work out the order there, then write it in as a waterfall and watch ten years of it run.
›How to check this
The November screenshots are the app itself, photographed on 02/10/2026, using the app's sample household with a few fields set for the scene: a Joint Account balance set so the no-rule month crosses zero, a Family Savings pot of £12,000 at 0% growth, £800 a month of joint contributions paid on the 28th (the 27th in November), and the car insurance entered as a £480 annual premium due on 16/11/2026. The two daily charts differ only in whether the joint account carries the floor rule shown in the settings crops. One thing the charts do not show: the engine applies the rule at month ends, and the daily lens shows each month's drawn-down total across that month, so the with-rule chart shows an October that has already been covered rather than a transfer landing on the 16th itself.
Both charts are output from CrestCast's own forecast engine, run on 14/08/2026 on a synthetic household, not from a spreadsheet built to illustrate the point. Two runs of the same profile were compared field by field, and the only input that differs between them is the cash routing policy.
The household, in full: a joint current account opening at £2,500; a joint savings pot of £32,000; a home worth £340,000; a £215,000 repayment mortgage at 4.5% over 25 years, which the engine prices at £1,195.04 a month. Income paid into the joint account is £2,750 and £2,450, so £5,200 a month. Monthly bills total £4,255: council tax £215, gas and electricity £185, water £48, broadband and mobiles £92, home and life insurance £74, car costs £385, groceries £780, childcare £1,050, children's clubs and activities £190, everyday spending and eating out £1,180, subscriptions and memberships £56. That leaves the household £250.04 a month short.
The routing policy in the second run is a £1,000 minimum with the savings pot named as the only drawdown source, no target balance and no waterfall steps, so the run isolates the drawdown behaviour rather than mixing it with sweeping.
Inflation, salary growth and savings growth are all set to 0%, so every figure is in today's money and the arithmetic is checkable by hand. That is also why net worth comes out exactly equal in both runs: with a real rate of return the routed run would end slightly lower, because the drained pot would not have earned it, and the unrouted run pays nothing for being overdrawn since the engine models no overdraft charges. The comparison is deliberately stripped back so that the only thing separating the two lines is the rule itself.
The forecast horizon is ten years, which is fixed in the app and is not a setting. Month figures are quoted at each anniversary. One caveat for anyone reproducing this: the engine's first month runs from the day you ask to the end of that month, so a run on a different date shifts the first month and moves the whole unrouted line by a constant. The slope of £250.04 a month is unaffected.
Decide once what the spare money does
Set a minimum to hold, an order to draw from, and where a surplus goes. Then watch ten years of that rule run through your own cashflow, profit and loss and net worth before you change a single standing order.
30 days free, no card. Then £7.99 a month or £79.99 a year for the whole household.
Put your own numbers in and see the next ten years.
30 days free, no card. Then £7.99 a month or £79.99 a year for the whole household.