Cash Flow Forecast vs Profit and Loss: What's the Difference and Why Does It Matter?
A cash flow forecast and a profit and loss statement measure completely different things. Understanding the gap between profit and cash, and why a healthy P&L can still leave you short, is one of the most practically useful things you can learn about your finances.
If you've ever wondered why a business can go bust while showing a profit, or why your bank account feels emptier than your income suggests it should, the answer almost always comes down to one thing: the difference between cashflow and profit and loss.
They measure different things. They tell you different things. And understanding both gives you a far clearer picture of your financial health than either does alone.
What a P&L Measures
A Profit and Loss statement (P&L) records income earned and expenses incurred during a period, regardless of when the cash actually moves. It answers the question: are we earning more than we're spending?
For a household, your P&L income is your salary, earned each month whether it lands on the 25th or the 1st. Your P&L expenses are your rent or mortgage, your bills, your food, your subscriptions. The bottom line tells you whether you're running a surplus or a deficit across the period.
For a business, a P&L might show a sale made in December even if the customer doesn't pay until February. The income is recognised when it's earned, not when the cash arrives. This is called accrual accounting, and it's the standard for any meaningful financial reporting.
What Cashflow Measures
Cashflow records when money actually enters and leaves your bank account, not when it's earned or owed but when the payment clears.
This distinction sounds subtle but it has enormous practical consequences. A business that issues a £100,000 invoice in November might not receive payment until January, but it still has to pay its staff in December. The P&L shows a profitable November. The cashflow shows an empty account that can't make payroll.
For households the same dynamic plays out at a smaller scale. Your salary arrives on the 25th. Your mortgage goes out on the 1st. Your energy bill is collected on the 15th. Council tax is the 3rd. If you've had an unexpected cost in the first week of the month, knowing that your income exceeds your outgoings on a P&L basis doesn't help you if you've nothing in the account when the direct debit runs.
The household version of the invoice is money you have earned and not yet been paid: a bonus that slips a month, an invoice a client sits on, a bill you have agreed to settle late. CrestCast handles that as a timing difference rather than a second number. You say when you now expect it, in your inputs under Actuals and one-offs, and the amount stays exactly as you entered it: the P&L keeps it in the month it was earned, the cash moves to the month it actually arrives, and the gap between the two shows on your net worth as a receivable until it clears. Nothing is re-typed, so the two statements cannot drift apart.
Cash Is King, Day to Day
There's a reason the phrase "cash is king" exists in both business and personal finance. You cannot pay a bill with theoretical profit, or settle a direct debit with equity. The only thing that actually prevents a missed payment, a bounced transaction, or a default is cash: money that is physically present in your account at the right moment.
Businesses fail every year not because they're unprofitable, but because they ran out of cash at the wrong moment. The P&L showed health. The cashflow didn't. This is why banks and lenders focus so heavily on cashflow projections. They want to know not just whether you make money, but whether you can pay your bills on time.
Which raises the question a cashflow forecast has to answer and most spreadsheets never do: what happens in the months where the cash is not there? A household does not sit and watch the account go further overdrawn. It moves money across from savings. Your forecast should not go overdrawn runs one household twice, with that rule off and then on, and shows both what the held balance is worth and what it quietly costs.
Why You Need Both
The P&L tells you the underlying story: is your household generating a surplus or running at a loss? If your income consistently exceeds your expenditure, you're building wealth. If it doesn't, you're eroding it. This is the long-run picture.
The cashflow tells you the operational reality: can you pay Thursday's bill? Will there be enough in the account when the rent goes out? It's the day-to-day management picture.
One Month, Two Answers
Here is a household month where the two statements disagree. The account opens with £1,500 and £3,150 of salary arrives on the 28th. Over the month £2,480 goes out: rent on the 1st, council tax on the 3rd, nursery on the 18th, car finance on the 25th, and energy, insurance, broadband and three food shops in between.
On paper the month is comfortably profitable: £3,150 earned, £2,480 spent, a £670 surplus. In the account it is overdrawn on 13 days, from the 15th to the 27th, with a lowest balance of −£980. The P&L says the household is fine. The cashflow says that for nearly two weeks it is borrowing from the bank, and it does not help that the salary lands on the 28th.
Move the same salary to the 7th and the P&L does not change at all, because it records what was earned and spent in the month and not the order. The cashflow changes completely: the lowest balance becomes £205 and the account is never overdrawn. Same household, same month, same surplus, and only one of the two statements notices the difference.
Where Mortgages Make This More Complex
One place where the P&L and cashflow diverge for households is the mortgage. Your cashflow shows the full monthly mortgage payment leaving your account, capital and interest together. But from a P&L perspective, only the interest portion is a true expense. The capital repayment is building equity on your balance sheet; it's an asset transfer, not a cost.
A concrete example makes the split clear. Take a £250,000 repayment mortgage at 4.5% over 25 years. The monthly payment is £1,390, and in the first month £938 of that is interest and £452 is capital, the equity you're buying back in your home. Those two components land on three different statements:
- Cashflow sees the full £1,390. That's what actually leaves your bank account, so it's the figure that decides whether the direct debit clears each month.
- The P&L sees only the £938 of interest. That's the true cost of borrowing, the price of the money, and the only part that counts as an expense.
- The balance sheet sees the £452 of capital. It isn't a cost at all: it moves from your cash into your home equity, lifting your equity by the same amount your cash falls, so it leaves you no poorer.
The split does not stay put. How a Loan Works follows the same mortgage year by year: the interest in the payment falls from £938 in the first month to £280 after twenty years, so the profit and loss cost of the loan shrinks while the cashflow cost stays exactly where it was.
The same three-way split applies to any borrowing, not just a mortgage, and the size of the interest slice is what decides how much of a payment is genuinely a cost. The loan repayment calculator gives you the monthly payment and the total interest on a personal loan or car finance, which is the part your P&L would actually see.
This means cashflow can appear tighter than your underlying financial health suggests, because a significant chunk of your monthly outgoing is quietly building net worth rather than being consumed. Understanding this distinction, between what costs you money and what rearranges it, is one of the more clarifying things you can do for your financial picture.
Saving and Investing Do the Same Thing
Mortgages aren't the only place this happens. Any time you move money into savings or investments, the same split appears. Putting £500 a month into an ISA, a pension, or a child's account is a real cash outflow, so your cashflow tightens by £500. But it isn't an expense: you still own that money, it's just changed form from cash into an asset. Your P&L and net worth barely notice, because nothing has actually been consumed.
This is exactly why a decision can look painless on paper and still leave you short. A Junior ISA is a striking example: contributions leave your account every year and can't be touched until the child is 18, yet a net worth view shows the money safely present and growing. The cashflow forecast is the one statement that tells you the truth that matters in a crisis, which is whether the cash is actually reachable when you need it.
Reading the Two Together
The most useful financial picture combines both. A strong P&L with poor cashflow timing signals a management problem that can be solved. A weak P&L with good cashflow management signals an income problem that needs addressing at source. And both together, alongside a net worth picture, give you the full three-dimensional view of where you actually stand.
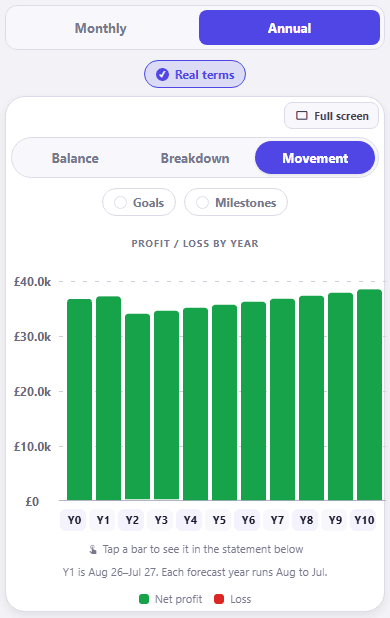
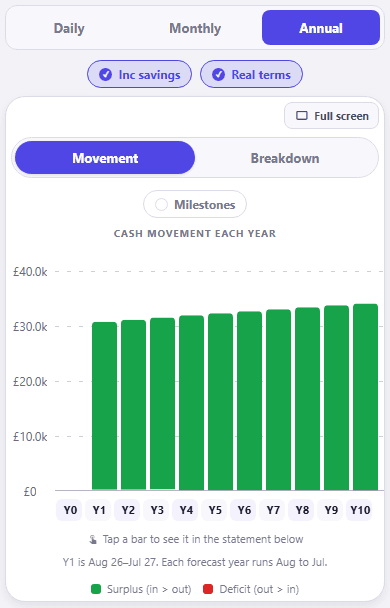
This is why CrestCast builds all three separately: P&L, cashflow, and net worth. Not because it's more complicated, but because each one tells you something the others don't. Seen together, they give you a genuinely clear picture.
›How to check this
Both screens are CrestCast's own P&L and Cashflow views for the same demo household, shown side by side, so the two pictures read off one set of figures.
No scenario was modelled or changed; the demo household's default forecast is shown as-is in both views, on the annual setting, with Real terms on and Milestones off, so both charts are stated in today's money and neither carries a dated-event flag. Both are on their Movement view, so each plots what passed through the period rather than what was left sitting at the end of it, which is what makes the two directly comparable. The Cashflow chart also has Inc liquid savings on, the app's default, which folds the liquid savings pots into the position.
The month in 'One Month, Two Answers' is illustrative arithmetic, not CrestCast output: an opening balance of £1,500, then rent £1,100 (1st), council tax £160 (3rd), broadband £35 (5th), food £120 (8th, 15th and 22nd), car insurance £55 (12th), energy £140 (15th), nursery £420 (18th), car finance £210 (25th) and salary £3,150 (28th), applied day by day. Outgoings sum to £2,480, so the surplus is £670 and the month closes at £2,170 whichever day the salary lands.
The mortgage split is standard amortisation of £250,000 at 4.5% over 25 years (payment £1,389.58, first month interest £937.50 and capital £452.08), rounded to the nearest pound.
Read both statements off one set of numbers
CrestCast builds your cashflow, profit and loss and net worth from the same entries, so you can ask both questions without keeping two spreadsheets in step.
30 days free, no card. Then £7.99 a month or £79.99 a year for the whole household.
Put your own numbers in and see the next ten years.
30 days free, no card. Then £7.99 a month or £79.99 a year for the whole household.